Stratagram
Network diagram editor · v1.0

Draw the idea, not the details.

Stratagram is a specialized tool for getting a network onto the screen in minutes. Standardized stencils and line types do the styling for you, so you think about the topology, and everyone on your team reads the result the same way.

Rust + Qt desktop appSame editor in the browserSVG · PNG · draw.io · CMLPlain JSON files
berlin-hq.stratagram — Stratagram
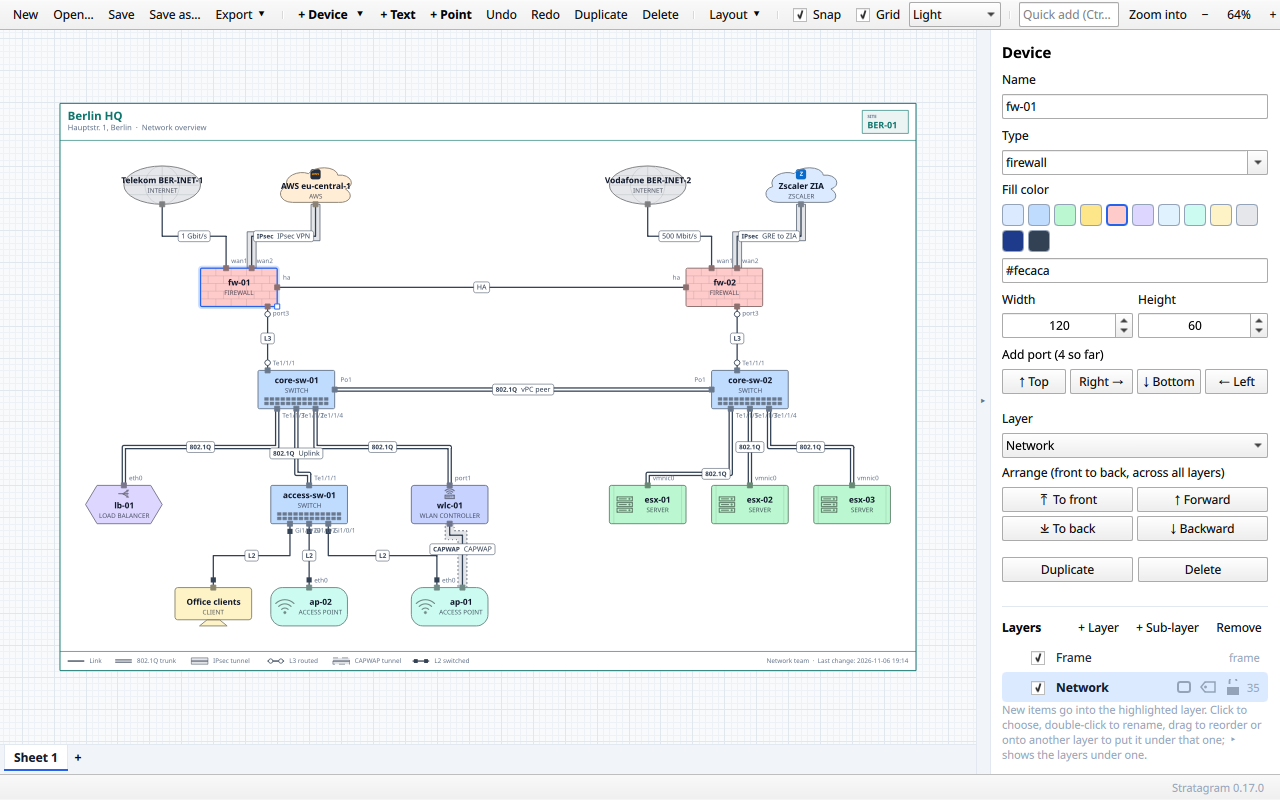
The Stratagram desktop app: a site diagram with firewalls, core switches, servers and access points in a title frame, the properties panel of a selected firewall on the right

The desktop app with a site overview in a frame; the panel edits the selected firewall.

Why Stratagram

A diagram is a conversation, not artwork.

General-purpose drawing tools give you a thousand shapes and a blank page, and every diagram ends up looking different. Stratagram gives you a small, fixed visual language for networks, and it does the layout. You spend the time on the idea.

⚡

Ideas first

Type Firewall, Router, switch|core-01 and press Enter. Drag from a border to connect. Pick a layout and the diagram arranges itself. A sketch for a meeting takes minutes, not an afternoon.

◆

One visual language

Every device type has its shape, symbol and color. Every line type says what it carries: a trunk is a double line, a tunnel a band, routed links show their interfaces. There are no styles to invent.

⇄

Made to be shared

Because everybody draws with the same stencils, a diagram from a colleague reads at a glance. Frames carry title, site, revision and a legend. Files are plain JSON, exports are SVG, PNG and draw.io.

Standardized stencils

28 device types, one look.

Routers, switches, firewalls, load balancers, wireless, servers and clients, virtual and distributed virtual switches, the internet, and cloud providers with their own tiles. The type sets outline, symbol and color, the same in every diagram, on screen and in every export.

  • Grouped by category in the type list; quick add knows short forms like fw, rtr, sw, lb, dvs.
  • Ten line types: 802.1Q trunk, L2 switched, L3 routed, L3 subinterface, IPsec, VXLAN, CAPWAP, SD-WAN, MPLS, plain.
  • Legends in the frame list the line types a diagram uses.
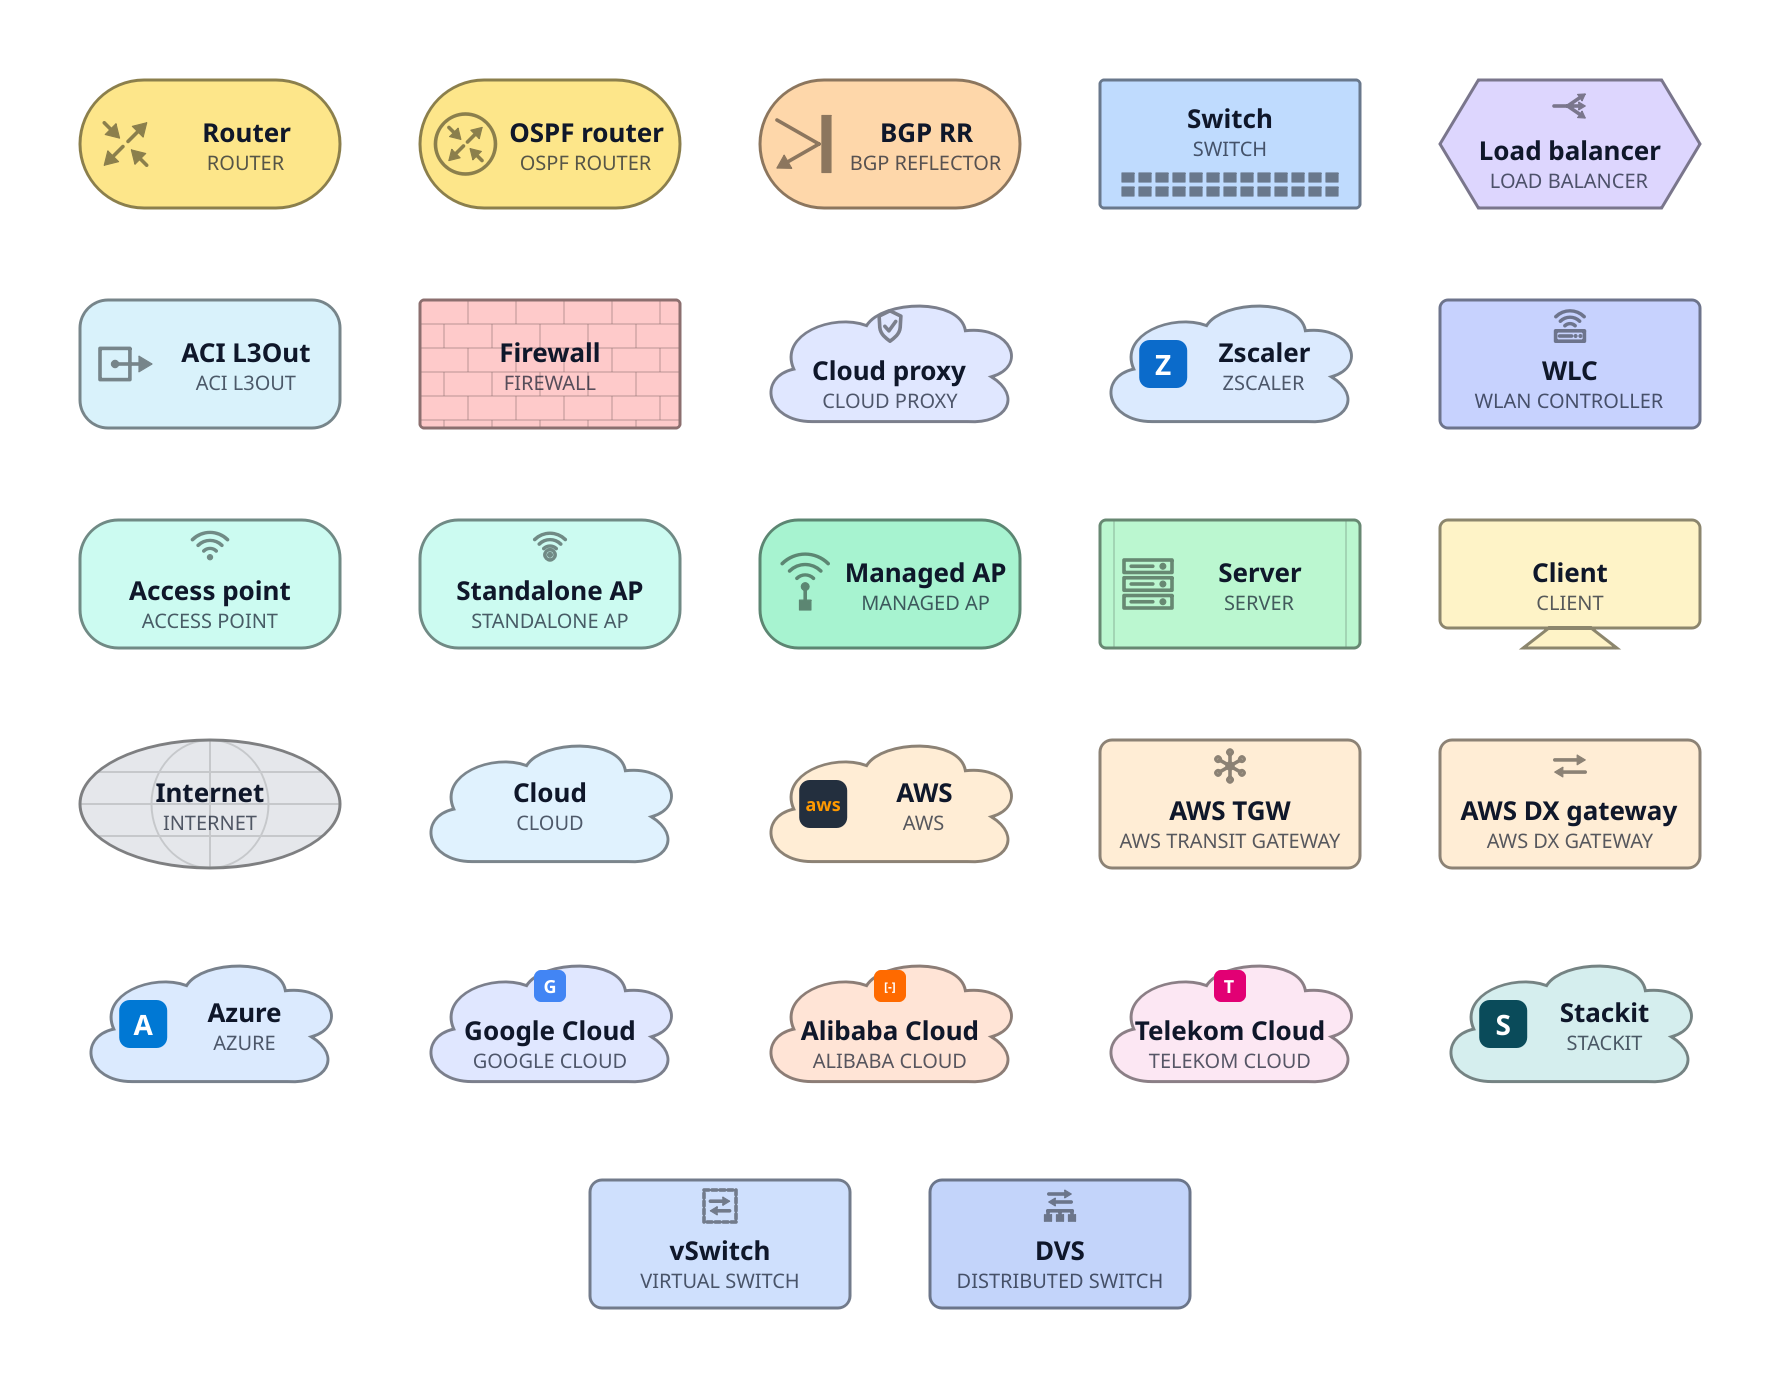
A sheet of all built-in device stencils: router, OSPF router, BGP reflector, switch, load balancer, firewall, cloud proxy, WLAN controller, access points, server, client, internet, clouds and cloud providers, virtual switch and distributed virtual switch
Fast

From empty page to topology in one line.

Quick add, connect by dragging, auto layout. The editor fills in what a whiteboard sketch leaves out: ports where lines meet, straight lines, room for labels.

  • Auto layout: hierarchy (top down or left to right, from the internet down to the clients), radial, circle, grid, force, or just tidy.
  • Lines that do not cross: auto layout lets a line leave its socket the other way, picks another route, or swaps neighbors, so as few lines cross as the ports allow; right-angled lines side by side each keep a lane of their own.
  • Smart guides: hold Ctrl while dragging and items line up, ports snap level so lines run straight.
  • Drop a device on a line to put it in between; bend lines through points; lines to nowhere for "out there".
  • Edit in place: double-click and type; undo for everything.
quick add · Ctrl+K
# comma separated, type then | and the name
› Internet, fw|fw-01, fw|fw-02, sw|core-01, sw|core-02, server|esx-01

# or from a script: files without positions are laid out
$ stratagram --layout hierarchy site.stratagram site.stratagram
$ stratagram --export-png site.stratagram site.png
$ stratagram --export-drawio site.stratagram site.drawio
$ stratagram --export-cml site.stratagram lab.yaml   # Cisco Modeling Labs
Down to the port

Switches and patch panels, front side up.

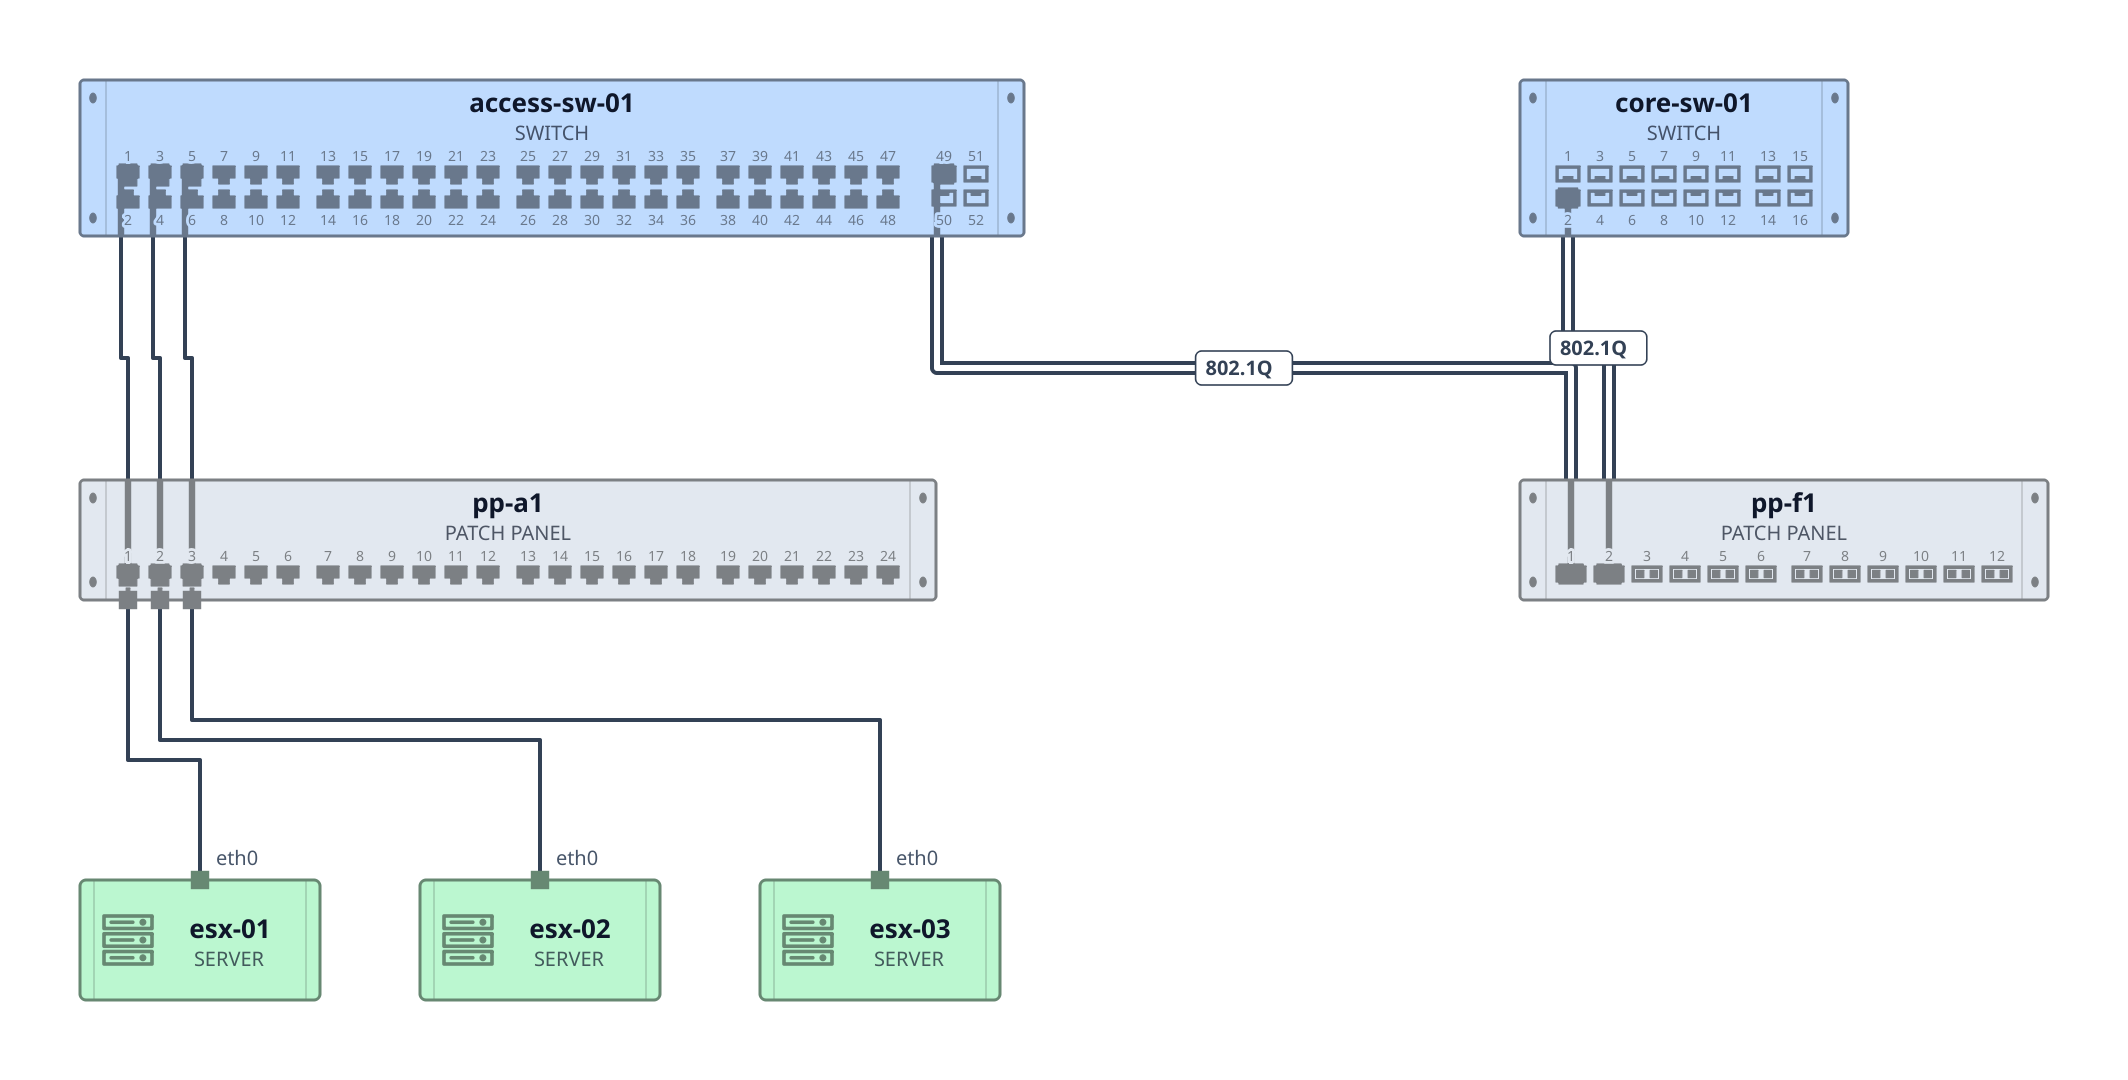
When it matters which socket a cable is in, switches, routers, firewalls, servers and patch panels show their front: numbered ports, odd on top and even below, RJ45, SFP, LC duplex or SC. Each socket is a connection point.

  • Any port count; the panel grows with it, SFP uplinks in a group of their own.
  • Cables plug in: a line ends in the middle of its socket (between the halves of a duplex LC).
  • Front and back: a rear port comes out right under its socket, so the way through the panel can be followed.
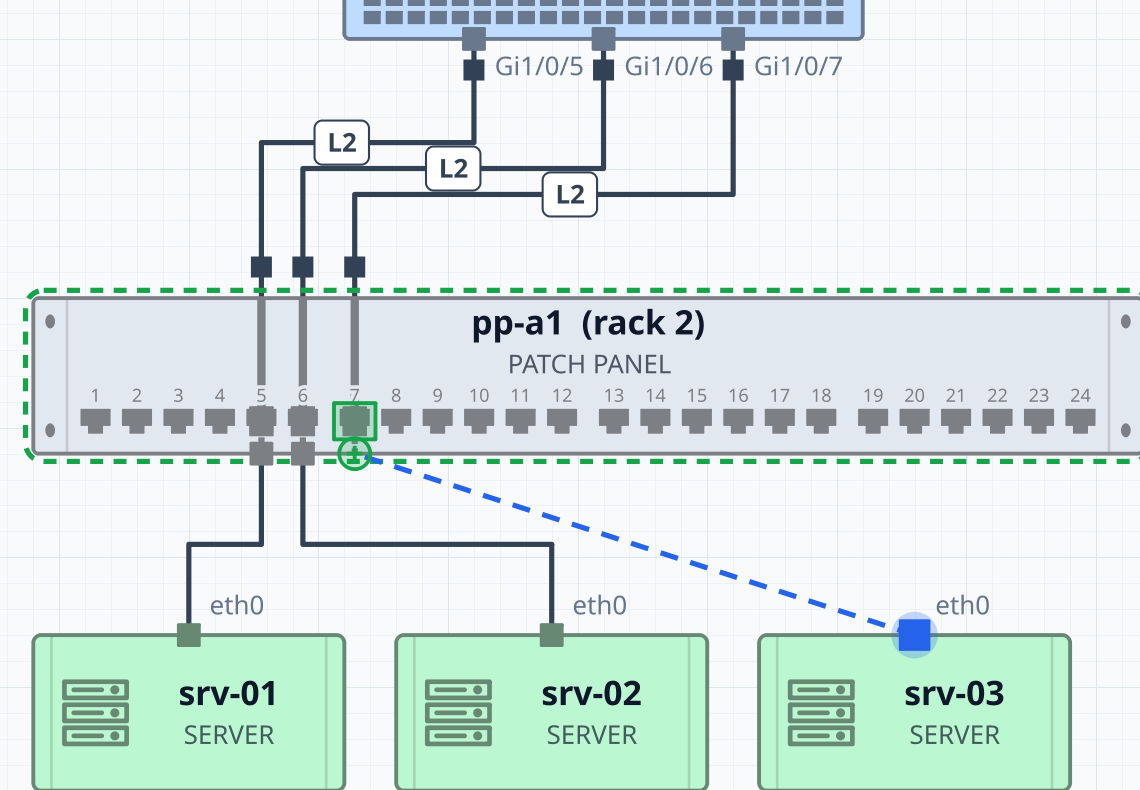
  • Cable the back by drag: draw a line to the panel's edge under a socket and, before you let go, the socket lights up and its tie shows, so you see which front port the cable ends up behind.
  • Opt-in: a switch, router, firewall or server stays a simple box until you give it ports.
A 48-port access switch with four SFP uplinks, an SFP core switch, a copper and a fiber patch panel, cables plugged into numbered sockets, servers below
A line being drawn from a server to the bottom edge of a patch panel: socket 7, cabled to the switch at the front, lights up with its tie to the edge before the line is dropped

Dragging to the back of socket 7: it lights up before the drop

Layers

Show what the audience needs, keep the rest.

Layers and sub-layers, as deep as you like, shown, hidden or locked together. Drag a layer to reorder it or onto another to put it underneath; the new parent lights up.

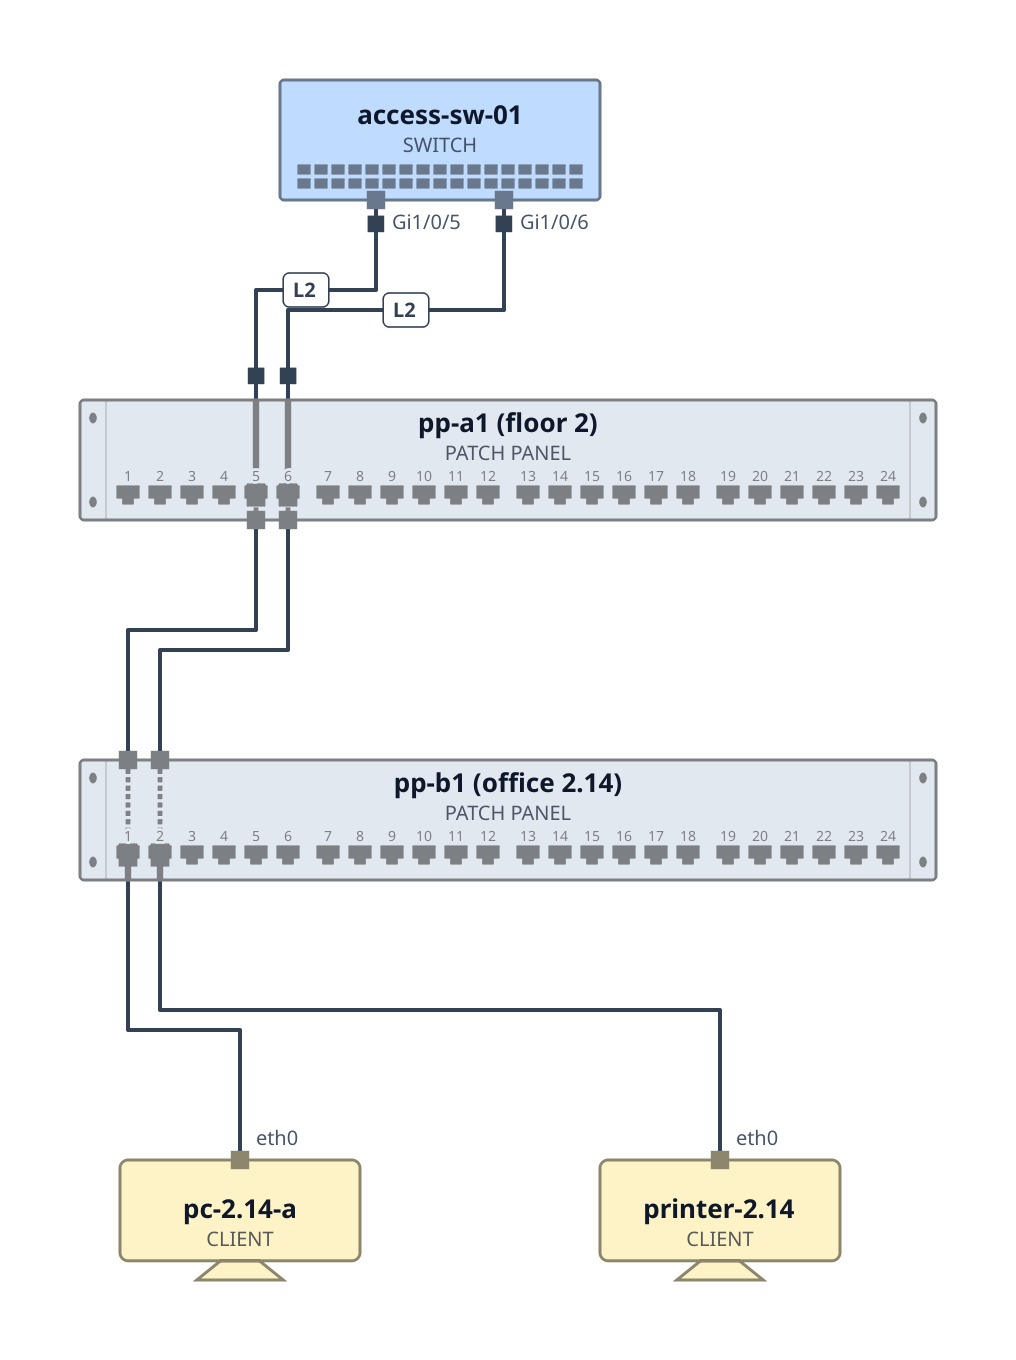
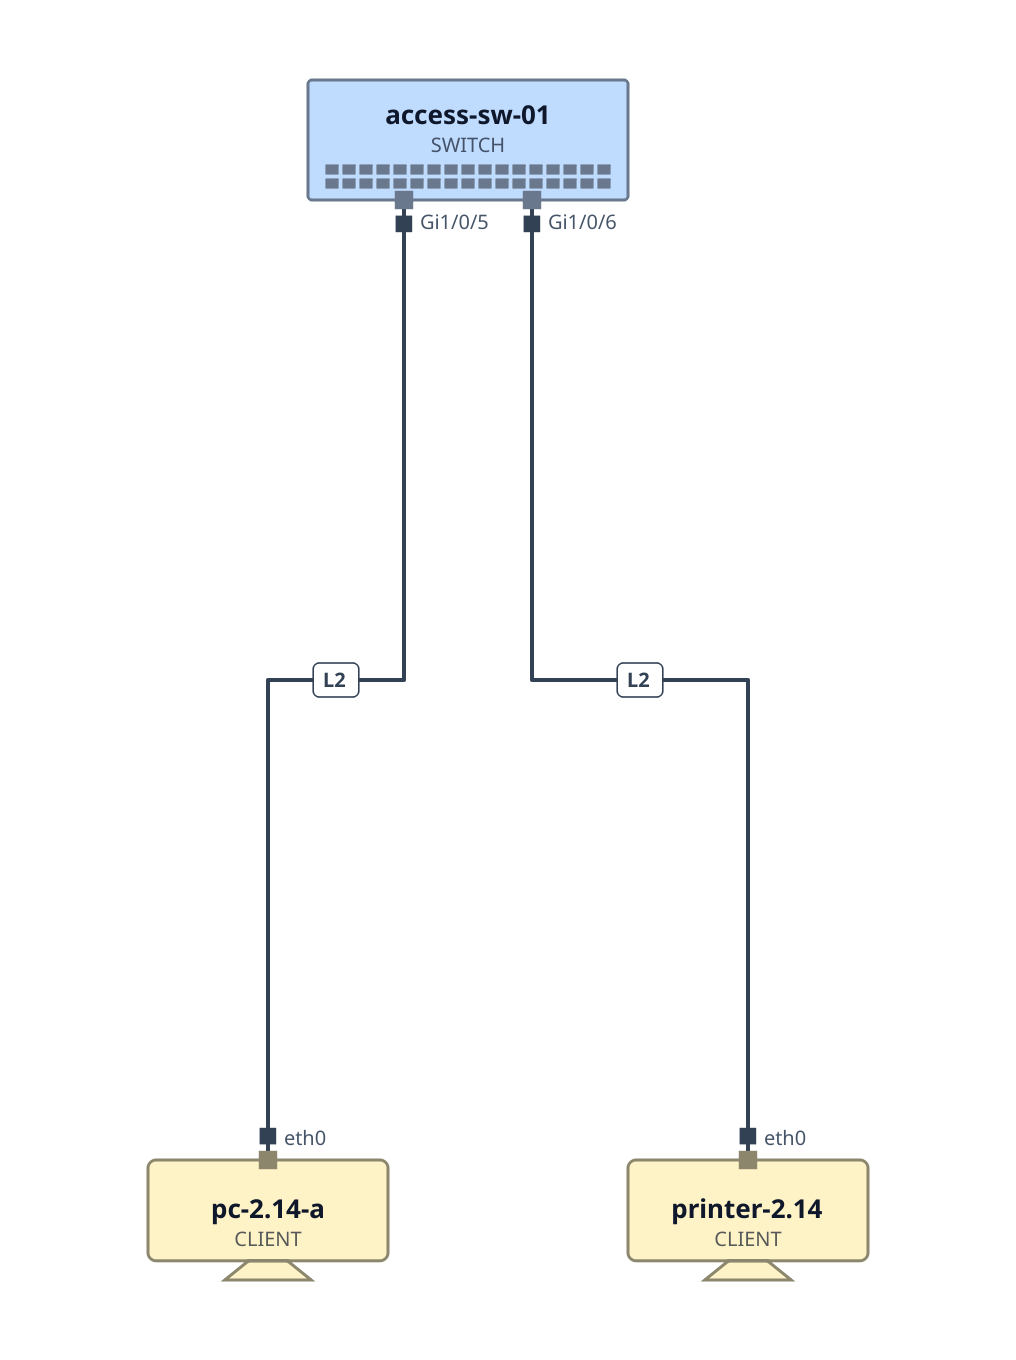
  • Cabling stays end to end: hide the patch panels and each device's line goes straight to the switch port it is patched to.
  • Backgrounds group a layer's items; layer names can show on their devices.
  • Sheets hold several pages in one file.
A switch cabled through two patch panels to a PC and a printer
The same diagram with the patch panel layer hidden: the lines go straight from the switch ports to the devices

Patch panels shown

"Patch panels" layer hidden

Deep zoom

Zoom into a device, keep drawing.

Turn on Zoom into (Ctrl+I) and the view zooms in without limit. Zoom into a server until it fills the screen and draw its VMs, its vSwitch and their lines inside it, at normal size. Zoom back out and the diagram looks exactly as before: the overview stays clean, and the details are there for whoever goes looking.

  • Any depth: each level is 8x smaller than the one around it, a rack in a site, a server in the rack, the VMs in the server.
  • Fades in and out: the inside shows from 400 % on, fully from 600 %; the grid and snapping follow the level.
  • Stays with its device: move the server and everything inside goes along; lines may run from inside out.
  • In every export, each item at its own scale.
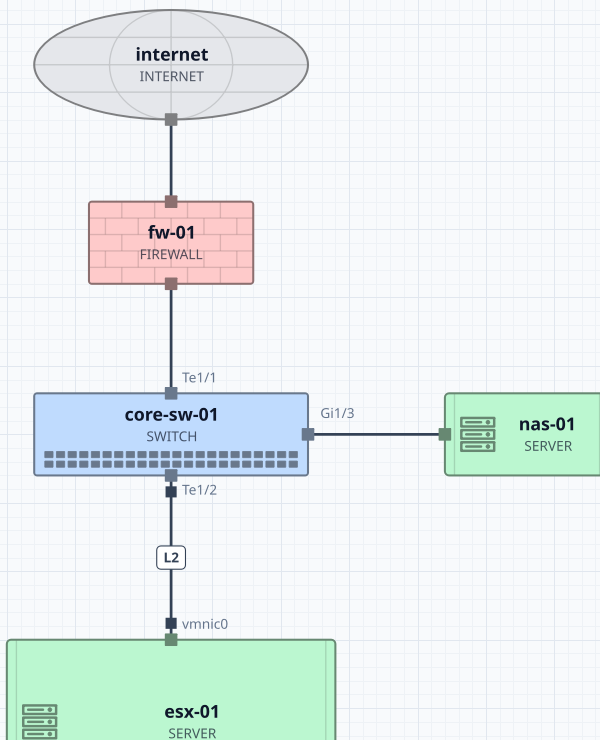
The overview: internet, firewall, core switch, a NAS and the ESX host esx-01 as a plain server box
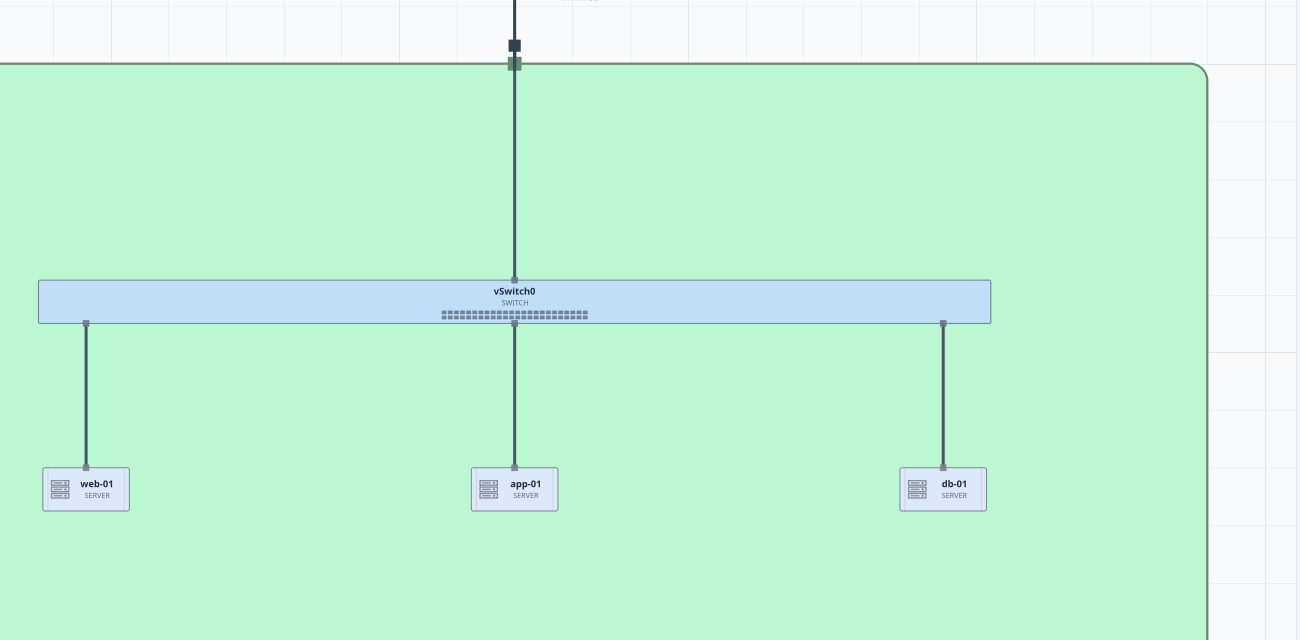
Zoomed into esx-01 at 577 %: its uplink vmnic0 runs to vSwitch0 inside it, cabled to the VMs web-01, app-01 and db-01

The site at 137 %

Zoomed into esx-01: its VMs

Ready to hand over

Frames, legends, exports.

23 frame templates, from a plain outline to ISO title blocks, revision tables, change and incident sheets, each with title, author, site, classification and the date of the last change. Set your company's defaults once.

  • SVG and PNG for documents, wikis, tickets and slides.
  • draw.io, editable, with ports and connections; paste back and forth with draw.io too.
  • Cisco Modeling Labs: turn the drawing into a lab topology to run.
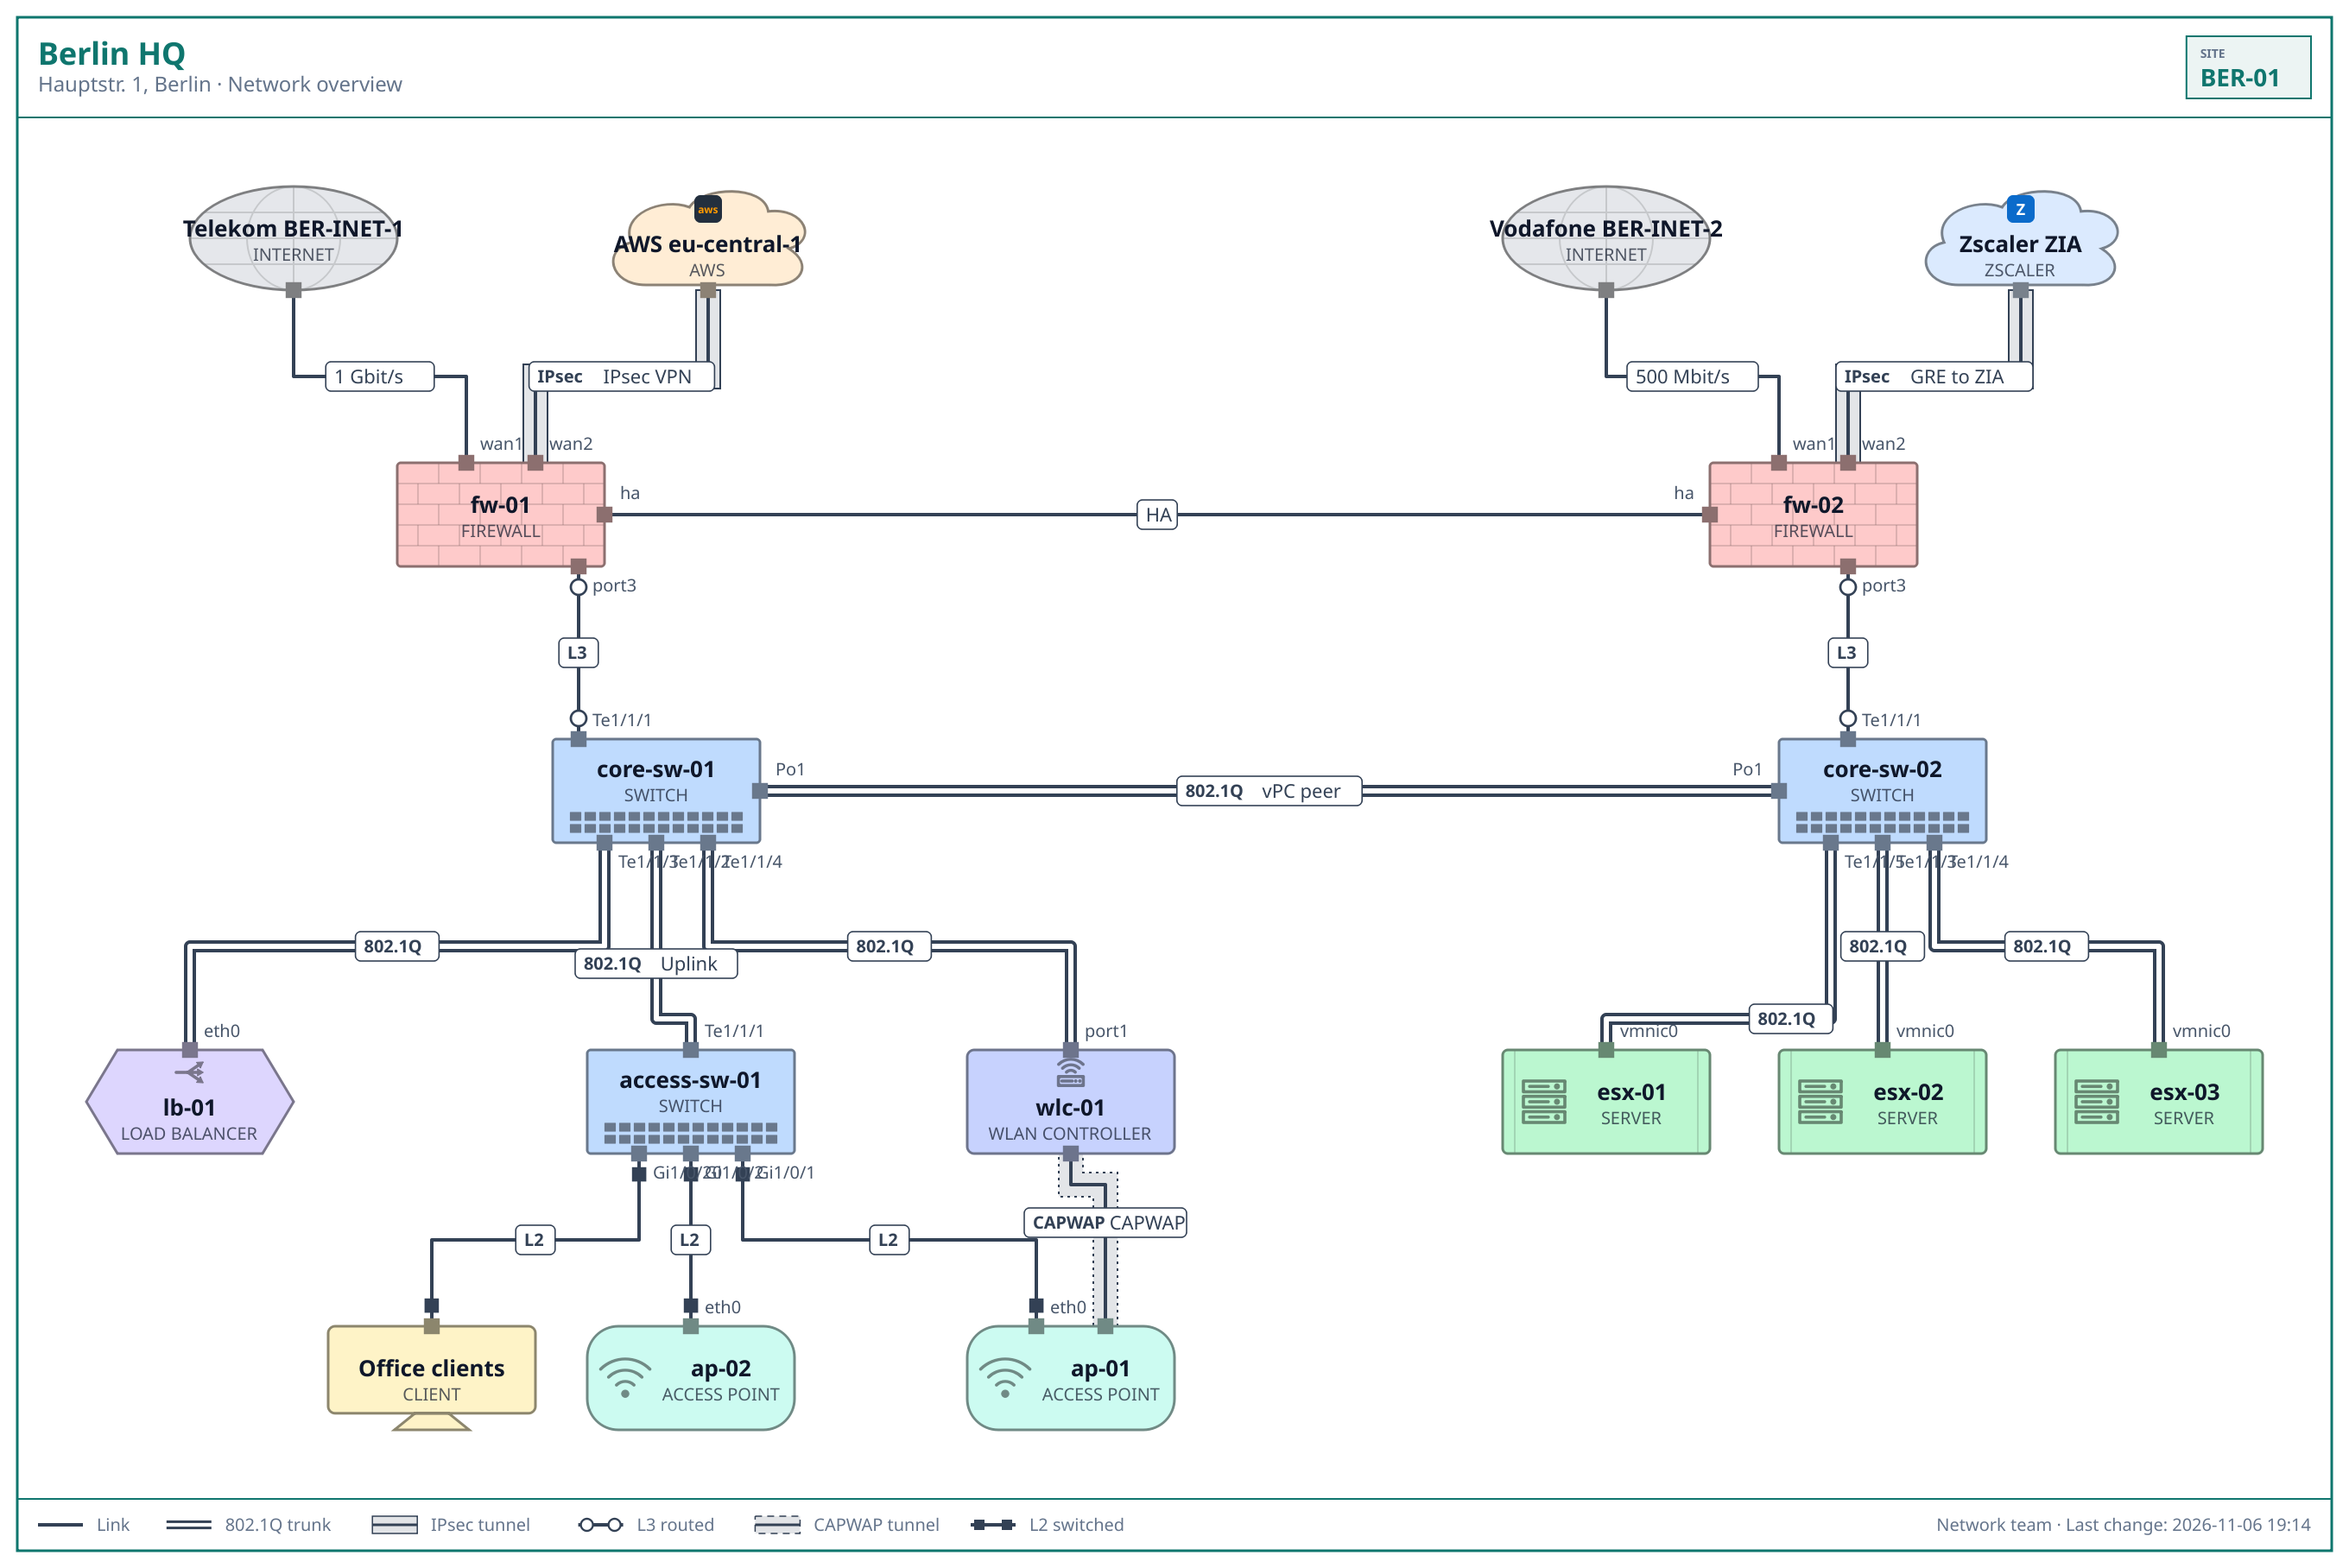
An exported PNG: the Berlin HQ network in a site frame with title, site code, legend of line types and the date of the last change
Themes

Light, dark, neon.

Pick a theme in the toolbar and the whole editor follows: the canvas, the panels and the drawing itself. Fills turn deep, lines and outlines bright, text light, so a diagram reads as well at night as on paper.

  • Your colors carry over: a light blue switch turns deep blue, custom colors keep their hue, cloud providers keep their brand colors.
  • The file stays the same: a theme changes how it is drawn, not what is saved, so everyone opens it in their own.
  • Exports follow: SVG and PNG come out in the theme you work in, also from the command line with --theme; draw.io keeps the file's colors.
  • Neon adds a soft glow to lines and outlines, on screen and in SVG.
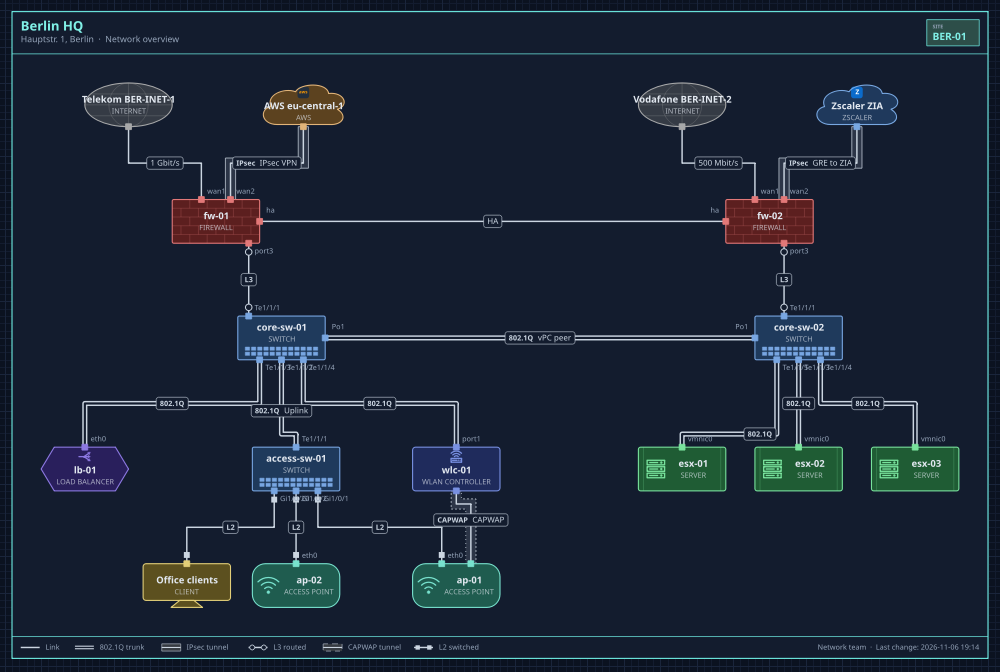
The Berlin HQ diagram in the Dark theme: deep fills with bright outlines and lines on a dark page
Follow the cable

Which port, which cable?

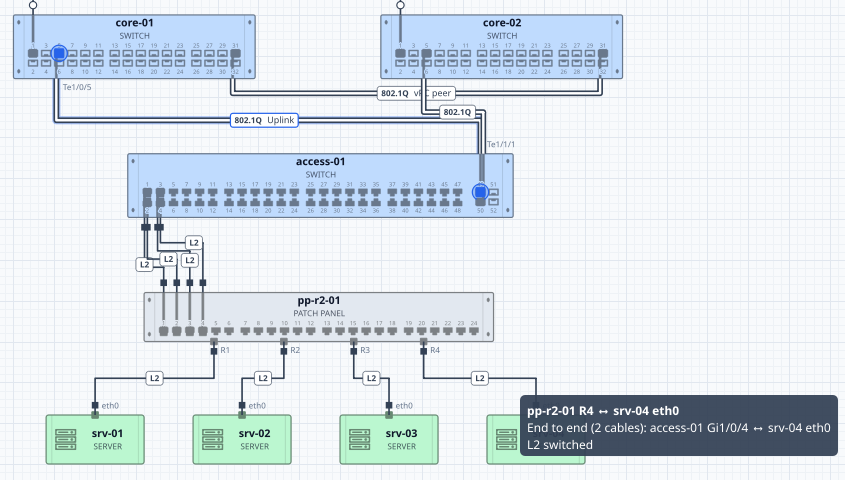
On a switch with 48 sockets, finding where a line ends takes a moment. Stratagram shows it: select a line and its ports light up, point at it and it tells you what it connects.

  • Select a line: the ports at both of its ends light up and show their names.
  • Point at a line: a note names its two ends (device and port, or socket), the run end to end when it goes on through patch panels, and its type and label.
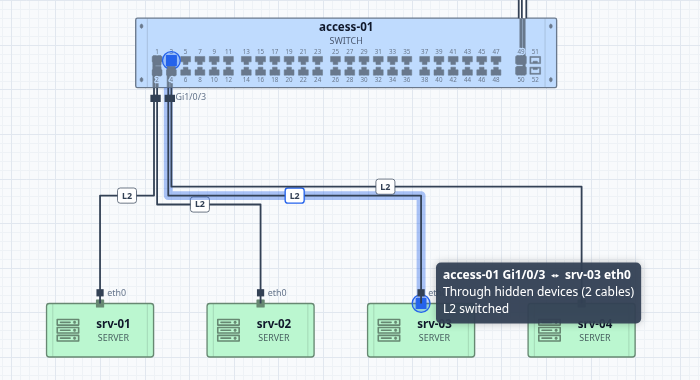
  • Through hidden layers too: with the patch panels hidden, the line straight from switch to server can still be selected and tells what is behind it.
The uplink from core-01 to access-01 selected, its ports Te1/0/5 and Te1/1/1 lit up; the pointer on the line to srv-04 with a note: pp-r2-01 R4 to srv-04 eth0, end to end (2 cables) access-01 Gi1/0/4 to srv-04 eth0, L2 switched
One editor, three places

Where you need it.

The same editor and the same look everywhere: pick the place that fits the moment.

Desktop

Your own workbench

Works offline, wherever you are, and your diagrams are plain files next to your other documents. From the command line, a script lays out and exports a whole folder of diagrams without opening a window.

Browser

Nothing to install

Open a link and start drawing, on any computer, even one where you may not install software. The same editor and the same files as on the desktop, and it can live inside your own portal or wiki.

NetBox

Right next to the data

Every site and location already has its diagram, drawn from what NetBox knows and brought up to date with a click. The team finds it where they already look, and each person sees only what they may see. More about the plugin →

Get started

Build it

Stratagram builds from source with Rust 1.85 or newer and Qt 6.8 or newer.

Install Qt 6

For example on Debian or Ubuntu; Fedora and Arch have the same as qt6-qtdeclarative-devel qt6-qtsvg-devel and qt6-declarative qt6-svg.

$ sudo apt install qt6-base-dev qt6-declarative-dev qt6-svg-dev qml6-module-qtquick \
    qml6-module-qtquick-controls qml6-module-qtquick-layouts qml6-module-qtquick-dialogs

Build and run

$ git clone https://github.com/shinsterneck/stratagram.git && cd stratagram
$ cargo build --release
$ ./target/release/stratagram examples/demo.stratagram

Or in the browser

$ rustup target add wasm32-unknown-unknown
$ web/build.sh && python3 -m http.server -d web/www 8000
NetBox plugin · NetBox 4.5 to 4.7

Your NetBox, drawn.

The plugin adds a Diagram tab to every site and location. It draws the site from what NetBox knows (devices, cables, circuits, patch panels) with Stratagram's stencils, and keeps your arrangement when NetBox changes.

Site and location tabsRefresh without moving thingsSaved in NetBoxObject permissionsLight and dark, like NetBox
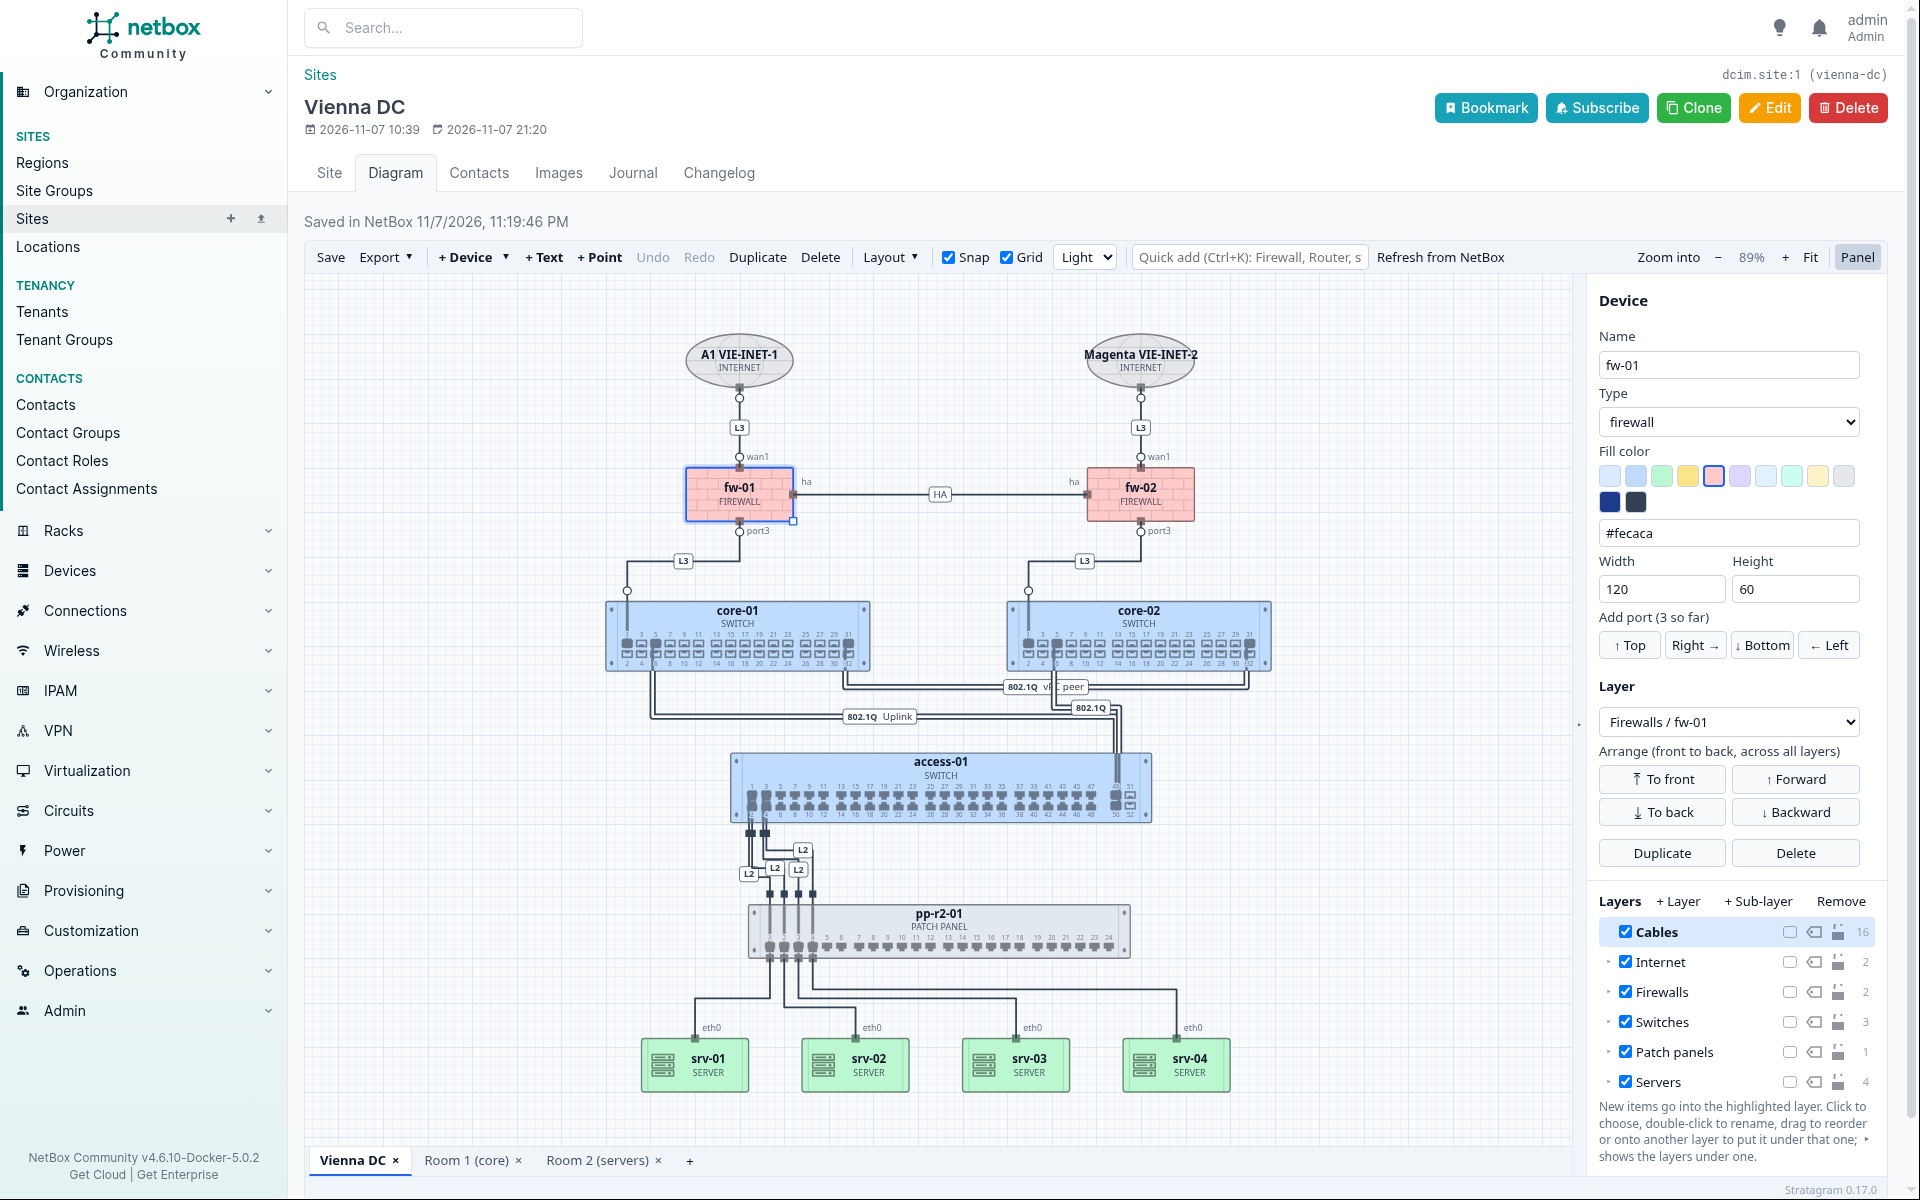
Vienna DC | NetBox
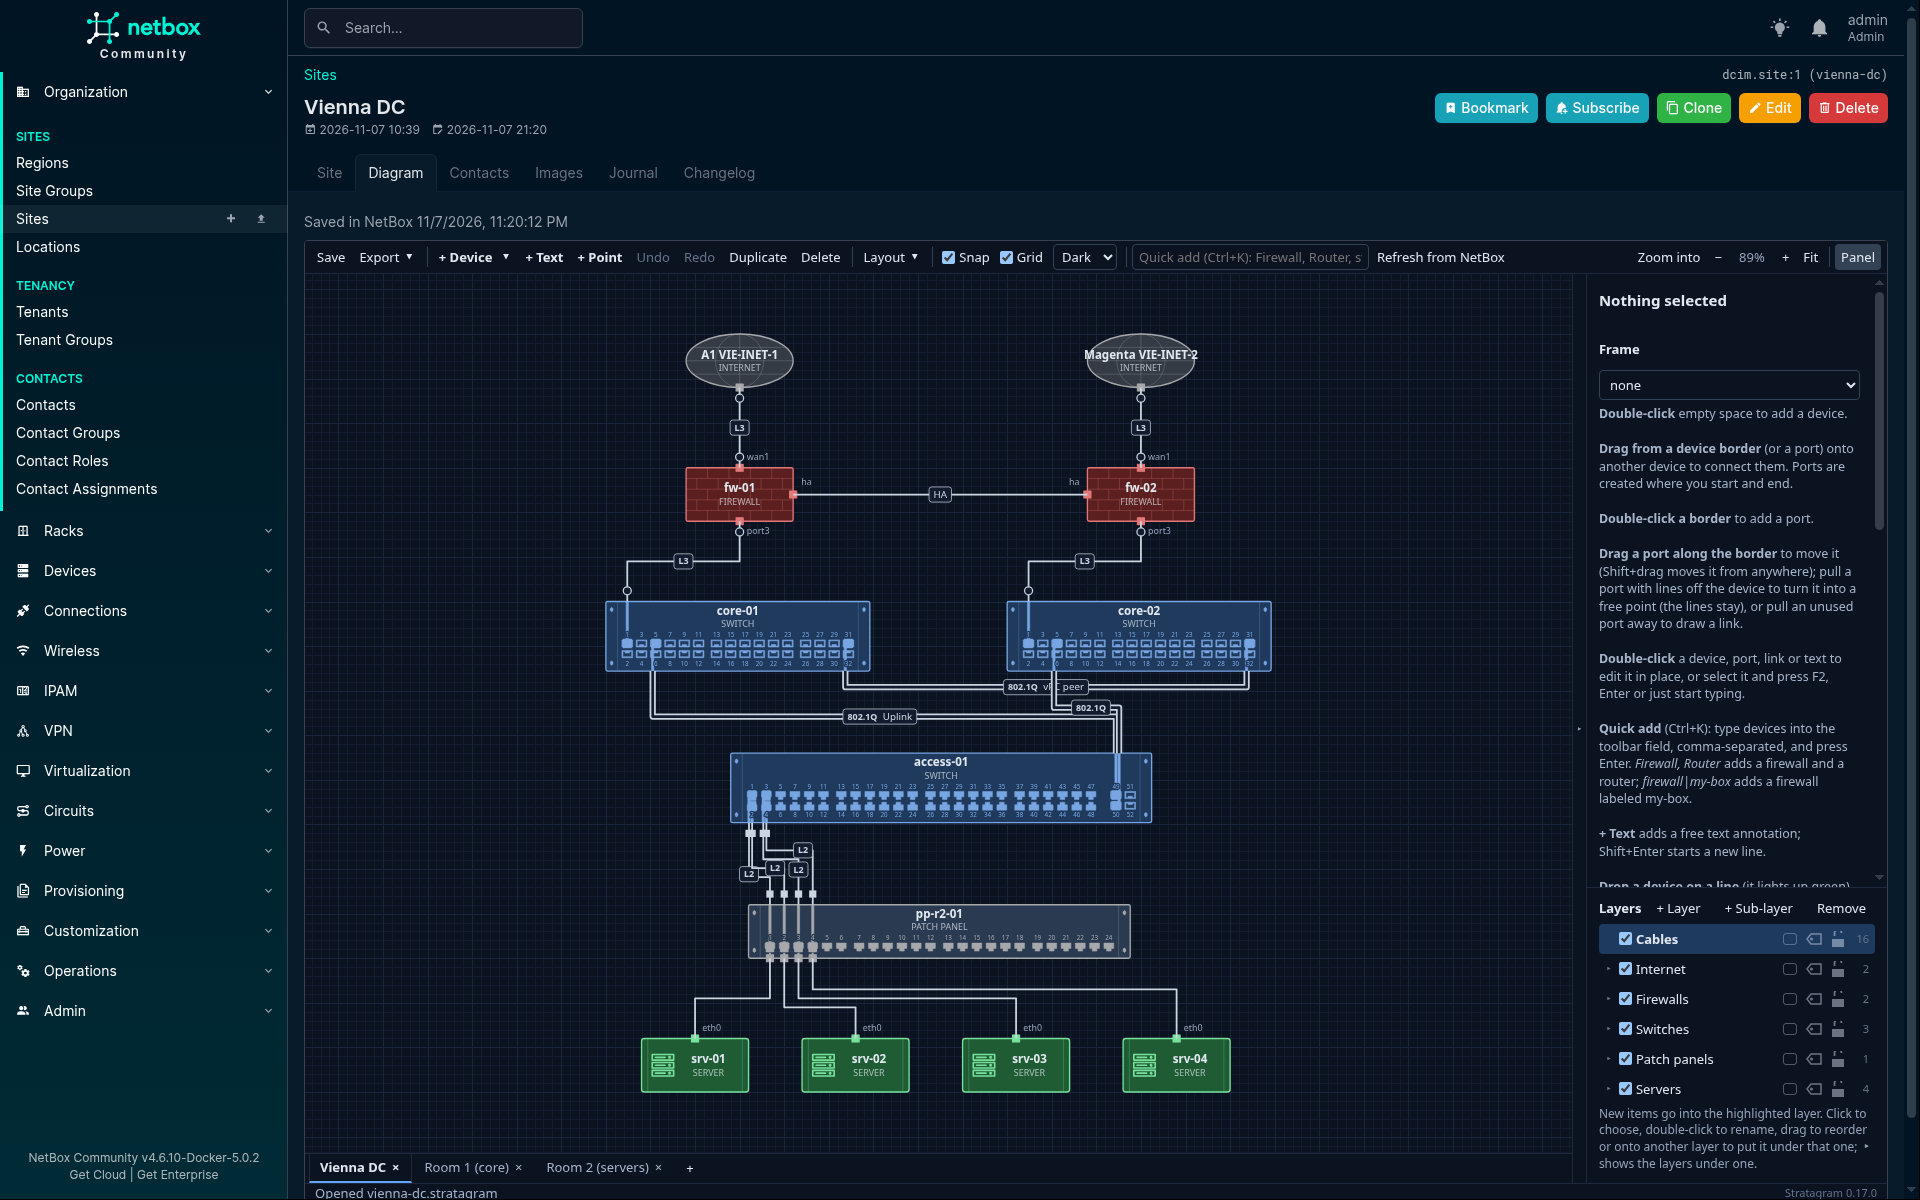
NetBox 4.6 with the Diagram tab of the site Vienna DC: two internet circuits, a firewall pair, core switches with SFP ports, an access switch cabled through a patch panel to four servers, sheets for the site's two rooms, the selected firewall in the panel and the layers by device type

The Diagram tab of a site in NetBox 4.6, drawn from its devices, cables and circuits. Each location is a sheet (tabs at the bottom); the layer tree has a layer per device type and per device.

From NetBox

Drawn from your source of truth.

No more redrawing a site by hand after every change. The site comes in with its devices and cables, laid out from the internet down to the servers.

  • Device types from roles: firewall, router, core and access switches, servers, with your own mapping where roles say something else.
  • Line types from interfaces: tagged ports make trunks, routed ends make L3 links, access ports L2.
  • Right-angled lines by default, each in a lane of its own and laid out with as few crossings as the ports allow (or straight, as you set it up).
  • Circuits become internet clouds named after provider and circuit; patch panels get one socket per front port, rear ports behind the sockets they map to; switches their physical ports, copper first and SFP as uplinks, each cable in its port.
  • Locations get sheets of their own; a location's Diagram tab opens its sheet.
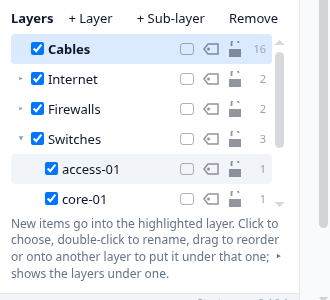
The layer tree in NetBox: Cables, Internet, Firewalls, Switches opened to a layer per switch (access-01, core-01), each with its count of items
Stays yours

Refresh, don't redraw.

Arrange the diagram, add notes, a frame, layers, and save it in NetBox. When NetBox changes, Refresh from NetBox brings it up to date without moving anything you placed.

  • New devices and cables are added beside what they connect to; renamed ones are renamed.
  • What is gone is set aside on a layer "Gone from NetBox", not silently deleted.
  • Layers by type and per device: show or hide all patch panels, or one server; cabling stays end to end along NetBox's cable paths, and a line through hidden panels can still be selected and tells what it connects.
  • One undo step; saved diagrams are in NetBox's change log.
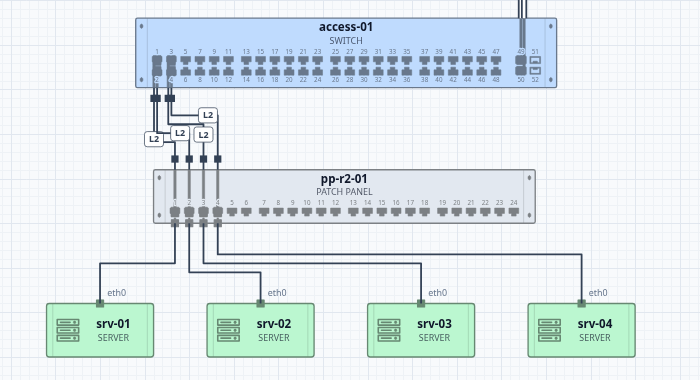
In NetBox: access-01 cabled to the front of patch panel pp-r2-01, its rear ports cabled to four servers
Patch panels shown
The same with the layer Patch panels hidden: each server's line goes straight to its port on access-01; the line to srv-03 is selected, its ports lit, and a note says access-01 Gi1/0/3 to srv-03 eth0, through hidden devices (2 cables), L2 switched
"Patch panels" hidden: end to end along NetBox's cable paths, the line to srv-03 selected and pointed at
Themes

Light or dark, like your NetBox.

The editor starts in NetBox's own light or dark mode and switches along with it. Pick Dark or Neon in its toolbar to keep one; the browser remembers it. The saved diagram keeps its colors, so everyone sees it in their own theme; SVG and PNG exports come out in the one in view.

NetBox in dark mode with the site diagram in the Dark theme: deep fills, bright outlines and lines
Dark, with NetBox's dark mode
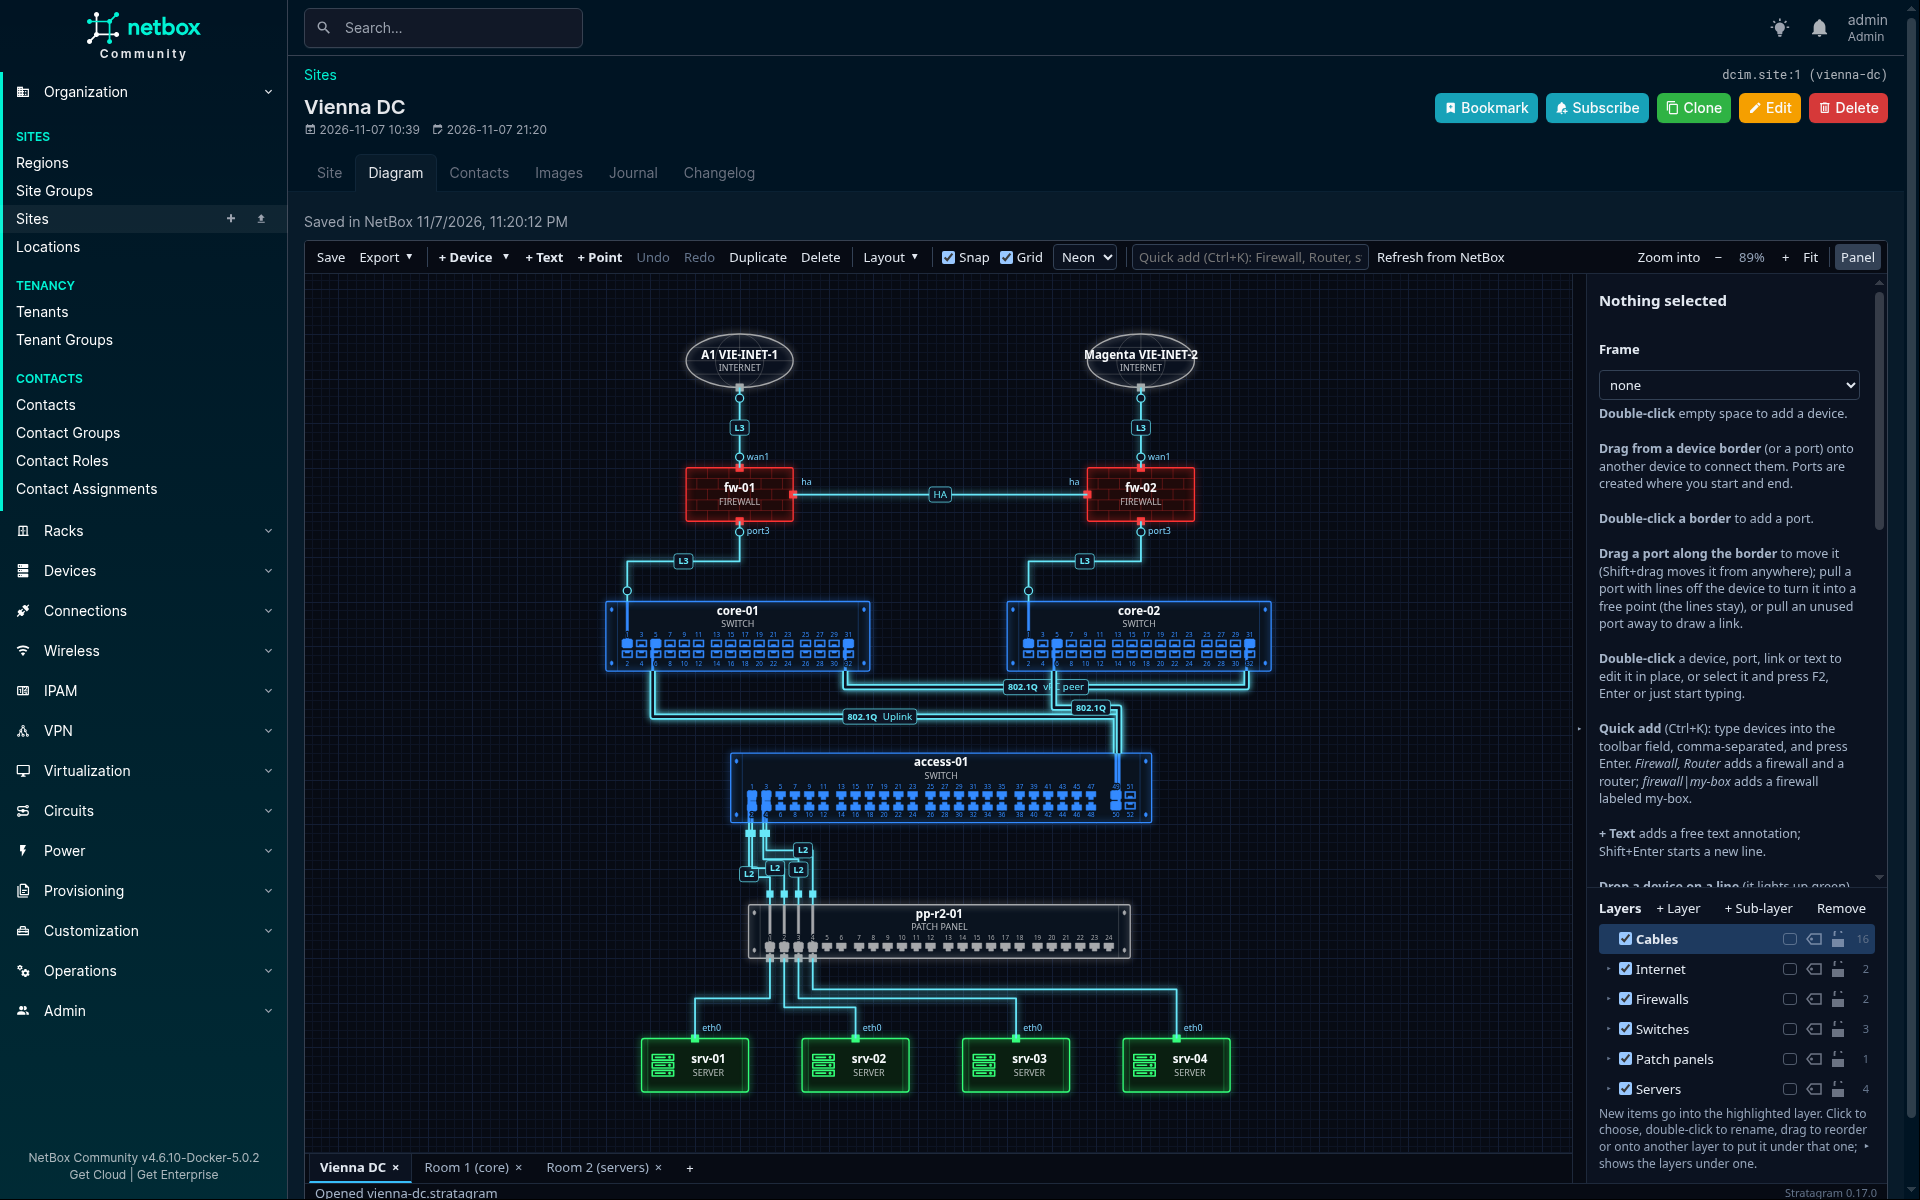
The same site diagram in the Neon theme: near-black fills with glowing outlines and lines
Neon
Access

Everyone sees what they may see.

The data comes from NetBox's own models, filtered by each user's object permissions, with no API tokens. Viewing, adding and changing site diagrams are NetBox permissions of their own, constraints included.

Install

Add it to NetBox

Build the package

Needs Rust with the WebAssembly target, wasm-bindgen-cli 0.2.129, cargo-about, and Python's build module.

$ netbox-plugin/build.sh      # → netbox-plugin/dist/netbox_stratagram-*.whl

Install it into NetBox's environment

$ sudo /opt/netbox/venv/bin/pip install netbox_stratagram-1.0.0-py3-none-any.whl

Enable it in configuration.py

PLUGINS = ["netbox_stratagram"]
PLUGINS_CONFIG = {
    "netbox_stratagram": {
        "kinds": {"dmz-host": "server"},   # device type by role, before the built-in guesses
        "all_devices": False,             # also devices without cables
        "type_layers": True,              # a layer per device type and per device
        "routing": "orthogonal",         # or "straight", "around"
        "fronts": ["switch"],            # drawn with their ports; also "router", "firewall", "server"
    },
}

Migrate, collect, restart

$ cd /opt/netbox/netbox
$ sudo ../venv/bin/python manage.py migrate
$ sudo ../venv/bin/python manage.py collectstatic --no-input
$ sudo systemctl restart netbox netbox-rq

Then grant the object type NetBox Stratagram › Site Diagram (view, and add and change to save) to the users who should see the Diagram tab.